When we are scoping out a project, we are asked to provide estimates for time and cost to certain confidence levels. At the start it might be +/-100%, then +/-30% and then +/-10% (or fixed price).
What we are doing is spending money and effort in order to learn more about what we are going to deliver before we get started on actually delivering it. Using a blanket level of confidence such as +/-30% could be introducing more risk into the project because most of the things that we work on actually have subset levels of certainty. Even at the very start of a project, when we are asked for +/-100% – some of the work will have +/-10% certainty, some +/-30% and the rest will be a bit of a wild guess (+/-100%). The risk that we are introducing by treating the whole estimate as a wild guess is that we will end up spending a lot more on investigation to get to the next levels of confidence than we really need to spend.
There is another way to express our levels of confidence. Imagine a stacked bar graph that could show the amount of work at the different confidence levels. At the start, and what we would call as a +/-100% level of confidence, it might actually be a very skinny layer at high confidence (+/-10 %), a bit more at medium confidence (+/-30%) and a large amount at wild guess level (+/-100%). Depending on the type of scope falling into the three different sections, we can then make better decisions about the remaining work to estimate the project and whether there is value in starting some of the higher confidence work earlier.
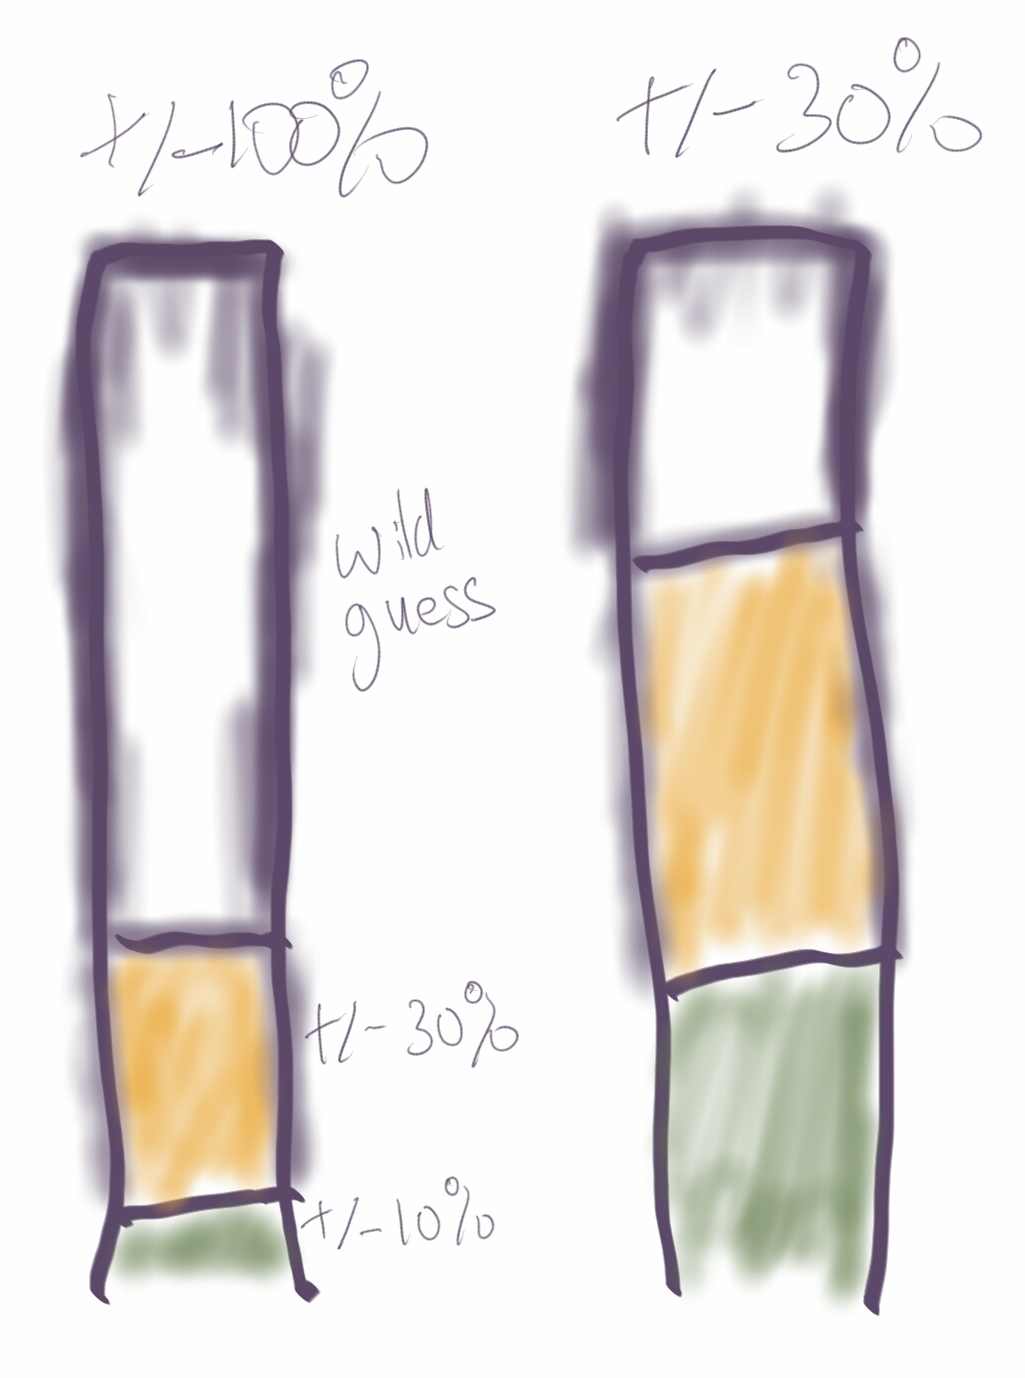 Even when we have an overall estimate to +/-30%, we will still have subsets of scope sitting at the high certainty and wild guess levels also. By expressing the estimate as an overall +/-30% we are hiding crucial information about the project which could be used to make better decisions, be indicators of untapped opportunities, or risks.
For example, if we are looking at a project estimate that looks like the bar graph on the right in the above picture, we could have a good discussion about the amount of effort required to drive out the uncertainty from the wild guess components. It might be the case that we should start the other components first because that work will inform the wild guess components or completing some of that work will make it easier to determine some aspects of the wild guess work. Without this type of visualisation, we will treat the entire scope as still only having medium certainty and might start some work prematurely or delay useful work and potentially over-invest in effort to gain more perceived certainty.